Introduction
Bat fatalities resulting from collisions with wind turbines have been extensively documented at operating wind farms throughout the United States. One leading mitigation measure involves curtailing the turbines during relatively low wind speed periods when bats are likely to be present, which has been shown to reduce bat fatalities significantly. While curtailment helps reduce bat mortality, it comes at a cost, that is, the revenue lost to the project because the turbines are not producing power during curtailment.
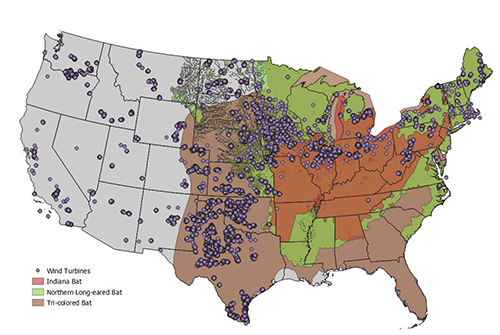
Figure 1: Overlap of ranges of species listed or proposed for listing under the Endangered Species Act with Wind Assets in the U.S (UNITED STATES).
Source: U.S Fish and Wildlife Service and U.S. Geological Survey
Implementing Bat Curtailment
The primary method to implement a curtailment strategy for bat protection is blanket curtailment. With blanket curtailment, the turbine’s cut-in speed is increased during times of night and periods of the year when bats are known to be active. The increased cut-in speed is pre-determined prior to commercial operations, as agreed upon with the governing regulatory agencies. A typical cut-in speed for a modern turbine in normal operation is around 3.0 m/s. A representative blanket curtailment cut-in speed might be 5.0 m/s, or higher, from sunset to sunrise when temperatures are above 50⁰F for the times of year when bats are known to be active at the site.
An alternative method is to use smart curtailment, such as Natural Power’s EchoSense system. With smart curtailment, acoustic sensors are used to listen for bat calls so that the turbines are only curtailed when bats are detected near the turbine and the other blanket curtailment criteria are met. The advantage of a smart curtailment system is that it reduces the amount of lost energy due to bat curtailment.
Calculating the Energy Lost Due to Curtailment
In addition to quantifying bat fatalities to determine the success of a curtailment strategy, it is also important to calculate an accurate estimate of lost energy production since this will directly impact the wind farm’s revenue. Lost energy is typically estimated by combining the wind speed frequency distribution during the curtailment period with the power curve of the wind turbine.
To calculate the lost energy due to any curtailment system, the manufacturer’s standard turbine power curve used for energy modeling must be modified to account for the increased cut-in wind speed. One important aspect of the modification is that although the cut-in speed is specified as a binary on-off function, real turbine rotors have inertia and control systems take time to act so the resulting power curve is not a step-function, but rather is a modified ramp up. In a study of the English Farms 170-MW wind farm in Iowa, Natural Power reviewed the curves below that had been provided by the client showing 10-minute averaged power output data summed into 0.1 m/s speed bins. The orange daytime curve represents the power curve in normal operation, the purple nighttime curve shows when the blanket bat curtailment system is implemented. The blanket curtailment set point for this farm was 6.9 m/s. It is clear from the curve that the turbines do not instantaneously ramp up once the cut-in speed is reached.
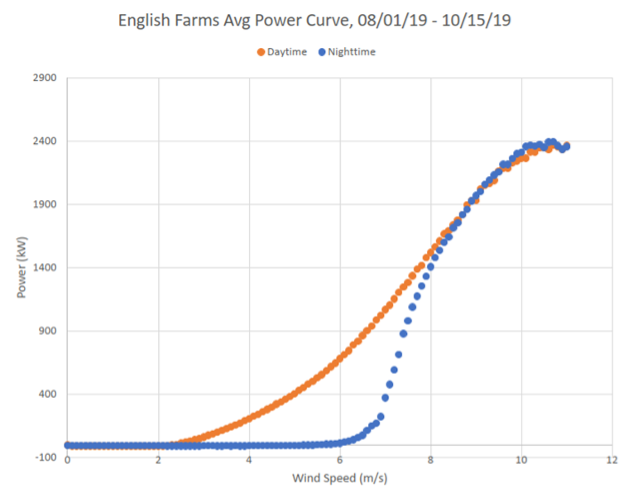
Figure 2: Power curve ramp up under normal (orange) and curtailed (blue) operation
This finding that control systems do not react instantaneously is supported by another study of a wind farm in the Midwest in which Natural Power found that turbines at times were still operating in a constrained mode above the 6.9 m/s cut-in threshold. This is visible in the histogram of wind speeds during curtailment events exceeding 6.9 m/s, as well as scatter to the right of the power curve during transitional periods of time when the turbine is ramping up to full power.
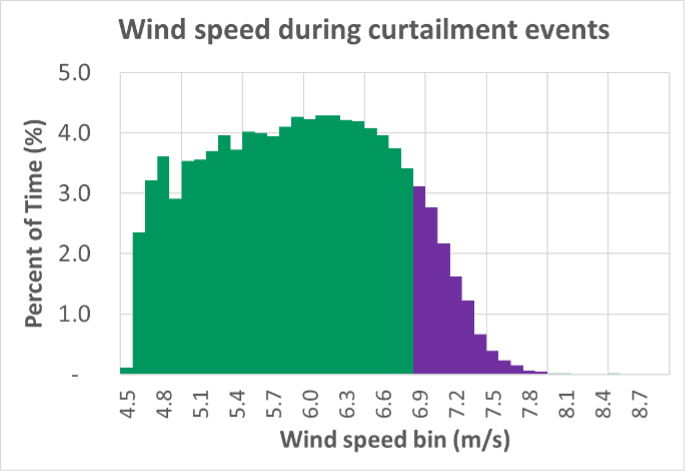
Figure 3: Histogram showing delayed ramping up to full power curve
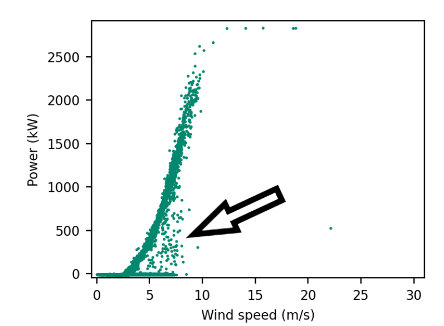
Figure 4: SCADA data showing scatter to the right of the normal power curve due to the curtailment system
Natural Power has found that an effective way to model this effect is to add a delay term in the time series analysis similar to the hysteresis factor at the turbine cut-out that accounts for this additional lost energy. For a blanket curtailment cut-in speed of around 6.0 m/s this can lead to an additional energy loss of approximately 1% of Annual Energy Production (AEP) compared with applying a simple step-function ramp up. The actual size of this additional loss will depend on the actual wind distribution at the site.
Reducing the Energy Lost by Curtailment
It is in the interest of the operator to try to reduce the lost energy by as much as possible while adhering to the regulatory agency’s operating constraints. The underlying principle of smart curtailment, such as EchoSense, is that curtailment is only implemented when bats are detected. This system was studied in operation at the English Farms wind farm in a multi-year study under a DOE (Department of Energy) grant (Reference 1).
The conclusion of the study was that the EchoSense system was able to reduce energy loss due to bat curtailment compared with blanket curtailment and would therefore provide significant economic benefits to the project. The plot below shows the reduction in lost energy achieved for a similar level of bat mortality compared with blanket curtailment.
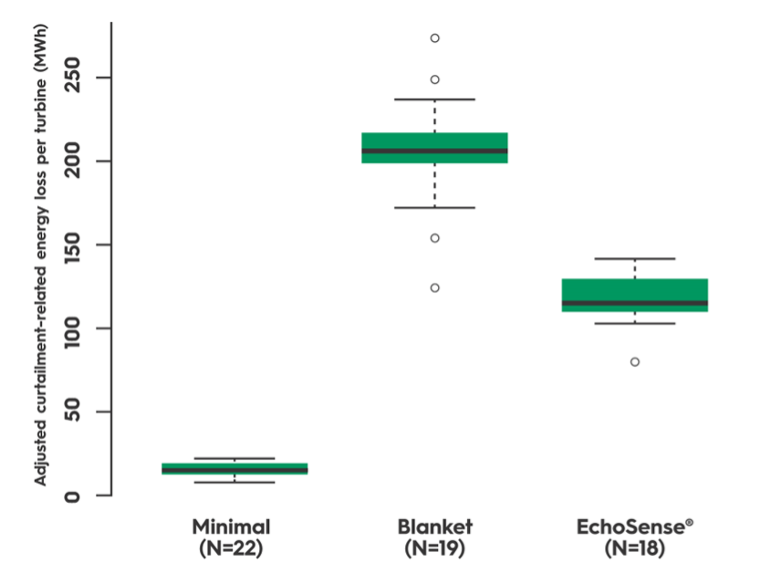
Figure 5: Impact on lost energy of different types of curtailment
How Natural Power Can Help?
Whether your project needs to have an energy assessment carried out that includes bat curtailment, a suitability assessment undertaken to show how much additional revenue your operating project can hope to gain by deploying an EchoSense system, or you just need advice as to how best to implement your bat curtailment strategy, Natural Power’s trained team of energy analysts, engineers, and bat biologists are ready to provide advice and support for your projects.
References
-
“Bat Smart Curtailment: Efficacy and Operational Testing” Department of Energy Report DE-EE0008900.0001 – currently in final review.